Campaign Analytics
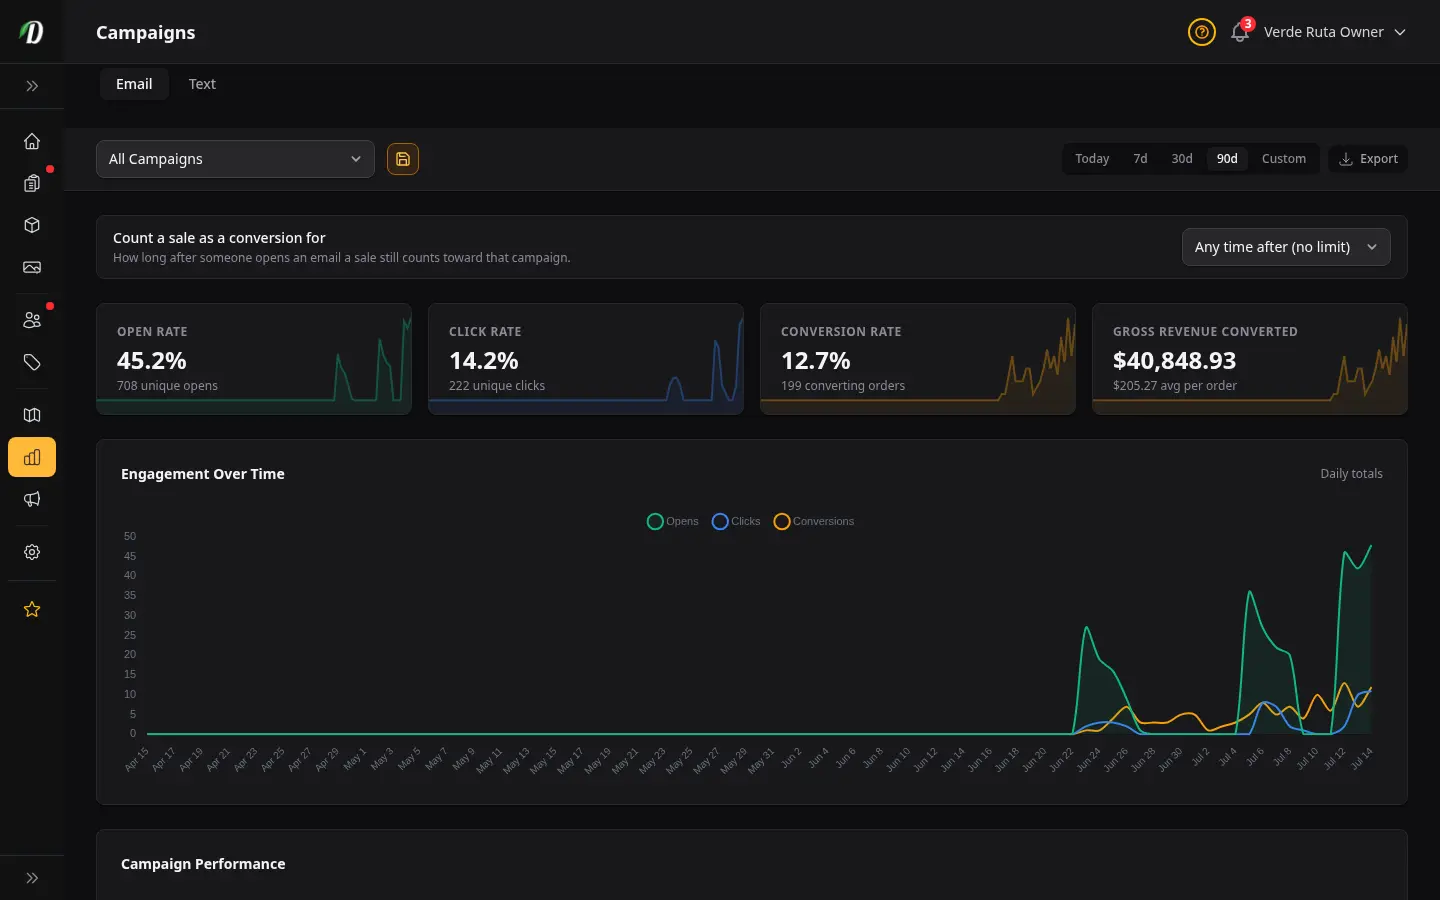
Measure every email campaign — sends, open rate, click rate, unsubscribes, conversions, and revenue — with an engagement chart and a per-campaign drill-down showing recipients, top links, and the 72-hour engagement timeline.
Overview
Campaign Analytics measures every campaign you've sent — sends, opens, clicks, unsubscribes, conversions, and the revenue those campaigns actually drove. It answers the question that open and click rates can't on their own: did the campaign make you money? Email and text campaigns each get their own tab, because they are measured differently.
Use it to compare campaigns against each other, spot which sends drove orders, and drill into any single campaign to see exactly who engaged and which links they clicked.
Tip: This report covers performance after a campaign is sent. To build and send campaigns, see Email Campaigns. To investigate failed sends, see Campaign Send Errors.
Email and Text Tabs
At the top of the report you'll find an Email tab and a Text tab. Each one measures only that kind of campaign, because emails and texts are not measured the same way.
- Shows open rate, click rate, conversions, and revenue, plus the daily engagement chart.
- Text
- A text message has no opens and no link tracking, so instead of open and click rates you see Texts Sent, Not Delivered, and how many were skipped — alongside the same conversions and revenue.
Why they are separate: a text blast can never record an open or a click. If texts were counted in your email numbers, every text you sent would look like a 0% open, 0% click send and pull your real email open rate down.
Filters
- Date Range
- Use the 7 Day, 30 Day, or 90 Day presets, or a custom from/to range. A campaign appears when it started or finished inside the range — and an in-progress (sending or paused) campaign that began earlier still shows, so an active send never disappears.
- Campaign
- The campaign dropdown lets you focus the whole report — cards, chart, and table — on one campaign. Choose All Campaigns to go back to the combined view, or click Clear.
Stat Cards
Four summary cards roll up every campaign in the current filter.
- Open Rate
- The share of delivered emails that were opened, across all campaigns in the range.
- Click Rate
- The share of delivered emails where the recipient clicked at least one link.
- Conversion Rate
- The share of recipients who went on to place a revenue-counting order after the campaign was sent.
- Gross Revenue Converted
- The total value of orders attributed to these campaigns — the dollar result of the sends.
How conversions are attributed: A conversion is counted when a recipient of a campaign places a revenue-counting order after that campaign was sent. The attributed revenue is the value of those orders — so you measure sales the campaign influenced, not just opens.
Table vs chart: The performance table and export show all orders ever attributed to each campaign — a lifetime scorecard. The daily chart's Conversions line respects your date filter and your store's Revenue Date setting, so you can see when those orders landed in your books (placed day vs scheduled delivery day).
Engagement Chart
The chart plots three series per day (or per hour, when the range is Today), bucketed by the day the event happened — not the day the campaign was sent.
- Opens
- How many times recipients opened a campaign email that day.
- Clicks
- How many link clicks happened that day.
- Conversions
- How many attributed orders count on that day for the selected campaigns. Uses your store's Revenue Date setting (placed day or scheduled delivery day) — not necessarily the day the campaign was sent.
Together these show the engagement curve — most opens and clicks land in the hours right after a send, then taper off over the following days.
Campaign Performance Table
The table lists every campaign in the range. Click any column header to sort by it.
| Column | What it shows |
|---|---|
| Campaign | The campaign name. Sortable. Selecting it opens the per-campaign detail view. |
| Finished | When the campaign completed sending. Hidden on small screens. Sortable. |
| Sent | How many emails were delivered for the campaign. Sortable. |
| Open Rate | Unique opens as a percentage of sends. Sortable. |
| Click Rate | Unique clickers as a percentage of sends. Sortable. |
| Unsubscribes | How many recipients opted out from this campaign. Hidden on small screens. Sortable. |
| Conversions | Attributed orders, with the converted revenue alongside. Hidden on the smallest screens. Sortable. |
Click Export in the filter bar to download the table as a CSV for reporting. The download matches the tab you're on — the Email export includes opens and clicks, the Text export includes delivery counts instead.
Per-Campaign Detail
Select a campaign — from the filter dropdown or by clicking its row — to open its drill-down. The detail view goes deeper than the summary table:
- Campaign Metrics
- Sends, open rate, click rate, unsubscribe rate, and conversion rate for this one campaign.
- Top Clicked Links
- The most-clicked URLs in the campaign, with total clicks and how many unique recipients clicked each — so you know what actually drew interest.
- 72-Hour Engagement Timeline
- An hour-by-hour view of opens and clicks for the three days following the send, showing exactly when engagement peaked.
- Recipient List
- A paginated, sortable list of every recipient with their email, sent time, opened time, first-clicked time, and delivery status.
Tips
- Sort by Conversions or revenue to find the campaigns that actually drove sales, not just opens.
- A high open rate with a low click rate usually points to a subject line that works but a body that doesn't — test a clearer call to action.
- Use the 72-hour timeline to learn the best send time — most engagement lands in the first few hours.
- Check Top Clicked Links to see which products or offers pulled the most interest, then feature them again.
- A rising unsubscribe rate is an early warning to slow your sending cadence.
Frequently Asked Questions
What does the DabDash Campaign Analytics report show?
Campaign Analytics measures every email campaign you have sent over the selected date range. Four stat cards summarise open rate, click rate, conversion rate, and gross revenue converted. An engagement chart plots daily opens, clicks, and conversions, and a sortable table lists each campaign with its sends, opens, clicks, unsubscribes, conversions, and attributed revenue.
How does DabDash attribute revenue to an email campaign?
A conversion is counted when a recipient of a campaign places a revenue-counting order after that campaign was sent. The attributed revenue is the value of those orders. This lets you see which campaigns actually drove sales, not just opens and clicks.
How do I see detailed results for one DabDash campaign?
Select a campaign from the filter dropdown, or click a campaign row, to open its drill-down. The detail view shows that campaign's metrics, the most-clicked links, a 72-hour engagement timeline of opens and clicks after the send, and a paginated list of every recipient with their delivery, open, and click status.
Why does an in-progress campaign still appear in the DabDash report?
A campaign that is still sending or paused shows in the report even if it started before your date range, so an in-flight send never disappears from view. Completed, cancelled, and failed campaigns appear when they started or finished inside the range.